React applications can slow down when components re-render too often, state updates propagate unnecessarily, or expensive computations run on every update. Identifying these bottlenecks can be difficult without the right tools. Fortunately, the React ecosystem provides powerful utilities that give insight into rendering behavior and help you understand exactly why components update.
This article explains how to diagnose and correct performance issues in React using three essential tools:
- React Profiler — for measuring render cost
- WhyDidYouRender — for detecting unnecessary re-renders
- useTrackedEffect — for understanding which dependencies triggered effects
1. React Profiler: Measuring Rendering Cost
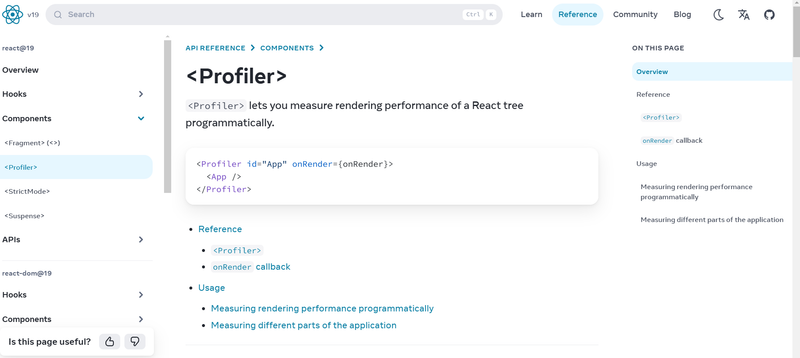
The React Profiler is built directly into the framework. It measures how long React spends rendering components and shows when updates happen, allowing you to pinpoint slow components or rendering patterns.
Wrap any part of your tree with <Profiler>:
import { Profiler } from "react";

function AppWithProfiler() {
  return (
    <Profiler id="App" onRender={onRender}>
      <App />
    </Profiler>
  );
}

function onRender(
  id,
  phase,
  actualDuration,
  baseDuration,
  startTime,
  commitTime
) {
  console.log({ id, phase, actualDuration, baseDuration, startTime, commitTime });
}
What to watch:
- actualDuration — time spent rendering. Values consistently above ~16ms may impact perceived smoothness.
- baseDuration — render cost without memoization. Good for evaluating
React.memo. - phase — mounting vs updating.
- commitTime — when React flushed updates to the DOM.
Profiler is especially helpful for:
- Components that render large lists
- Layout-heavy or animation-heavy UI
- Pages with global state updates that cascade into many components
2. WhyDidYouRender: Detecting Unnecessary Re-Renders
One of the most common performance issues in React is unnecessary re-renders. These occur when a component updates even though none of the values it depends on have changed. WhyDidYouRender helps trace and log these events.
Installation (Vite Example)
npm install @welldone-software/why-did-you-render -DAdd to vite.config.js:
import react from '@vitejs/plugin-react';

export default defineConfig({
  plugins: [
    react({
      jsxImportSource: "@welldone-software/why-did-you-render"
    })
  ],
});
Create wdyr.js
import React from "react";
import whyDidYouRender from "@welldone-software/why-did-you-render";

whyDidYouRender(React, {
  trackAllPureComponents: true,
  trackHooks: true,
  collapseGroups: true,
});
Import it before rendering your app
import "./wdyr.js";Enable it for a component
MyComponent.whyDidYouRender = true;What WhyDidYouRender tells you
- Which props changed
- Whether the change was deep‑equal or referential
- Which parent component caused the re-render
- Whether a component could benefit from
React.memo
This tool is especially useful when:
- You pass objects or arrays as props
- You frequently update global state
- Simple UI interactions trigger large tree updates

3. useTrackedEffect: Understanding Dependency Changes
useTrackedEffect is a custom hook that reveals which dependency changed between renders. This makes it easier to understand why a useEffect triggered and whether the update was necessary.
import React, { useState } from "react";
import { useTrackedEffect } from "../hooks";

export default function Example() {
  const [count, setCount] = useState(0);
  const [other, setOther] = useState(0);

  useTrackedEffect(
    changes => {
      console.log("Dependencies changed:", changes);
    },
    [count, other]
  );

  return (
    <div>
      <button onClick={() => setCount(count + 1)}>Inc Count</button>
      <button onClick={() => setOther(other + 1)}>Inc Other</button>
    </div>
  );
}
What this hook helps diagnose:
- Effects running more often than expected
- Objects/arrays recreated every render
- State changes in unrelated branches of the tree
- Missing memoization (e.g.,
useCallback,useMemo)
Instead of guessing which value changed, useTrackedEffect tells you directly.
Practical Tips for React Performance
1. Memoize expensive components
export default React.memo(MyComponent);2. Avoid creating objects inside JSX
// avoid
<Component options={{ x: 1 }} />

// better
const opts = { x: 1 };
<Component options={opts} />
3. Use stable callbacks
const handleClick = useCallback(() => doSomething(), []);4. Reduce global state churn
Only store truly shared data in global stores; local state is often faster.
5. Virtualize large lists
Libraries like React Window or React Virtuoso prevent rendering thousands of elements at once.
Conclusion
Optimizing React performance requires understanding how and when components update.
- React Profiler helps measure render duration.
- WhyDidYouRender highlights unnecessary re-renders.
- useTrackedEffect reveals which dependencies triggered effects.
By incorporating these tools into your development workflow, you gain visibility into rendering behavior, avoid wasted renders, and ship React applications that feel smooth and responsive.