If you’ve encountered the dreaded error:
FATAL ERROR: Ineffective mark-compacts near heap limit Allocation failed - JavaScript heap out of memory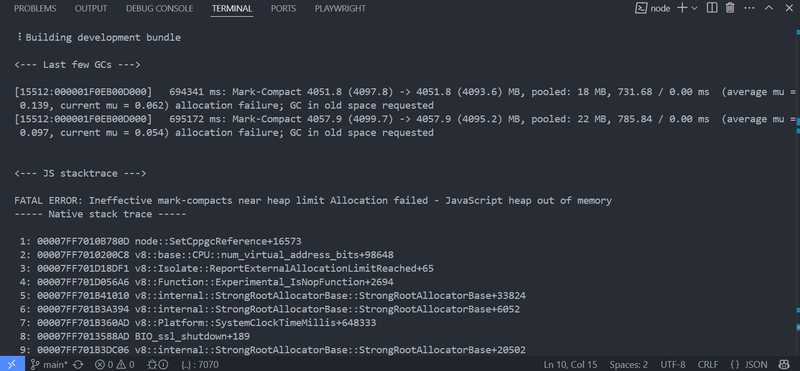
You’re not alone. This error typically occurs in Node.js applications when memory usage exceeds the default limit (usually 512 MB or 1.76 GB depending on version and system architecture).
In this guide, we’ll cover all known ways to resolve or work around this issue.
1. Increase Node’s Memory Limit
The easiest and most common solution is to increase Node’s memory allocation limit using the --max-old-space-size flag:
node --max-old-space-size=4096 your-script.jsThis sets the memory limit to 4 GB. You can go higher depending on your machine:
node --max-old-space-size=8192 your-script.js # 8GBFor npm/yarn scripts:
node --max-old-space-size=4096 node_modules/.bin/webpackOr define it in your package.json:
"scripts": {
  "build": "node --max-old-space-size=4096 node_modules/.bin/next build"
}
2. Use Environment Variable for Memory (cross-env)
For cross-platform builds, use cross-env:
npm install --save-dev cross-env"scripts": {
"build": "cross-env NODE_OPTIONS=--max-old-space-size=4096 next build"
}3. Optimize Your Code / Build Tool
Memory leaks and poor bundling practices can also be the cause:
- Avoid in-memory caching of large assets
- Use lazy loading
- Reduce bundle size with tree-shaking
- Avoid huge
require()orimport()graphs - Split large builds into smaller chunks
If you’re using webpack, try enabling cache, limiting plugins, or using webpack-bundle-analyzer.
4. Upgrade Dependencies
Outdated libraries (especially ones using large polyfills or older versions of TypeScript) can drastically impact memory. Upgrade to latest versions:
npm outdated
npm update
5. Use a More Efficient Build Tool
Some tools like Webpack or Babel are heavier in memory than newer tools like:
For example, switch from Webpack to Vite for large React projects.
6. Use node --inspect to Analyze Memory
You can profile memory usage using the Chrome DevTools:
node --inspect your-script.jsThen open chrome://inspect in Chrome and look for memory usage.
7. Use Worker Threads or Child Processes
If a single Node process needs too much memory, consider offloading work to a worker_thread or separate child_process:
// worker.js
parentPort.postMessage(expensiveOperation());// main.js
const { Worker } = require('worker_threads');
new Worker('./worker.js');8. Garbage Collection Tweaks (advanced)
You can tune V8’s GC behavior:
--expose-gc --max-semi-space-size=128Then manually call GC when idle:
if (global.gc) global.gc();These are advanced and situational; use with care.
TLDR
- Use
--max-old-space-size=4096 - Profile with
--inspect - Optimize code, split tasks
- Switch to efficient tools
Still stuck? Run a profiler or memory analyzer like clinic.js or Chrome DevTools to dig deeper.